Last time I showed a simple circuit that can be used to measure unknown thermistor parameters. The circuit is basically just a power MOSFET using a voltage and duty cycle controlled PWM signal to drive the gate and thus generates a temperature reference which is measured by both the unknown thermistor and the precision temperature sensor LM335. By measuring the voltage drop across the thermistor at different temperatures, we can obtain the R-T curve of the thermistor and thus estimate the parameters that define the R-T curve using some known models.
Here is the diagram of the measurement circuit again:
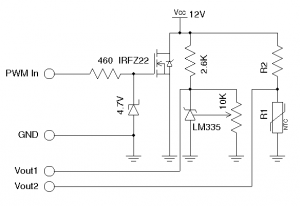
The thermistor (R1) is attached directly to the heat sink and close to the LM335 so that we can assume that both the thermistor and the LM335 are measuring the same temperature. The current limiting resistor R2 is chosen so that the voltage resolution is as high as possible (e.g. the voltage change across R1 is maximized over the measured temperature range) and at the same time the self heating effect is negligible.
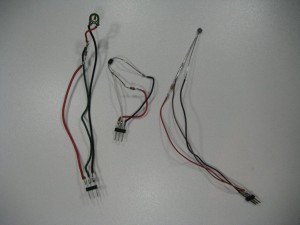
The picture below shows the three unknown NTCs I used in my test. These three NTCs measure roughly 8K, 10K and 18K under room temperature. And the current limit resistors are chosen after some experiments. For the 8K NTC, I used a 1.783K resistor. For the 10K NTC, I used a 2.643K resistor and for the 18K NTC, I used a 2.164K resistor.
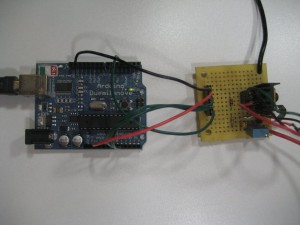
The PWM signal is supplied via an Arduino board. The reference voltage readings from LM335 and the voltage reading across the unknown NTC are feed to the analog pins of the MCU.
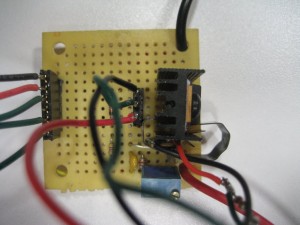
Here is a close up of the measurement board, you can see that the unknown NTC is clamped onto the heat sink adjacent to the LM335 sensor.
Depending on the thermal conductivity of the heatsink, it takes time for the heatsink surface to reach a stable temperature. Thus, the temperature must be increased slowly in order to obtain accurate results. One way to control the heatsink temperature is to use a PID controller to adjust the pulse width of the driving signal and only measure the NTC readings after the desired temperature is stabilized. This approach can become quite complex as it requires fine tuning of the controller parameters to reduce overshoot and oscillation.
Here we will take a simpler approach by simply increasing the pulse width of the control signal slowly over time. This method works quite well in general. But since the temperature increases faster at higher pulse width, the MOSFET heat-up curve is more exponential than linear. This could introduce some error when the temperature is high since there will be fewer sample points in that range. But for our experiment, this should not be an issue as the A/D converter precision is limited to 10 bits in ATmega328, and the measurement error would largely be coming from A/D conversion resolution than anywhere else.
The following is the code listing:
//The voltage of the USB power supply to Arduino,
//if higher precision is required, this voltage needs
//to be regulated.
double Vcc = 4.864;
double V = 0;
double TC = 0;
double TK = 0;
double TF = 0;
int tOn = 0; //PWM on time
double val1 = 0;
double val2 = 0;
int refVal = 0; //analog reading from LM335
int measureVal = 0; //analog reading from NTC/PTC

const int refTempPin = 0; //analog pin 0
const int measurePin = 1; //analog pin 1

const int pwmPin = 3; //digital pin 3

void setup()
{
  Serial.begin(9600);
  analogWrite(pwmPin, tOn);
  delay(10000);
}

void loop()
{
  val1 = 0;
  val2 = 0;

  //using average over 10 iterations
  for (int i = 0; i<10; i++) {
    val1 += analogRead(refTempPin);
    delay(20);
    val2 += analogRead(measurePin);
    delay(20);
  }

  refVal = (int) (val1 / 10.0);
  measureVal = (int) (val2 / 10.0);

  V = (double) refVal/ 1024.0 * Vcc; //Measured voltage
  TK = V * 100.0 ; //Kelvin
  TC = TK - 273.0; //Celcius
  TF = 9.0/5.0 * TC + 32.0; //Fahrenheit

  Serial.print(V);
  Serial.print(" ");
  Serial.print(TC);
  Serial.print(" ");
  Serial.print(measureVal);
  Serial.print(" ");
  Serial.println(tOn);

  //The highest temperature is set to be 110 Celcius
  //and the maximum PWM width is set to 100/255
  if (TC < 110 && tOn < 100) {
    tOn++;
    analogWrite(pwmPin, tOn);
  }

  //This delay needs to be at least 10 seconds to allow
  //the heat sink to be uniformly heated.
  delay(10000);
}
And the measured data is sent via the UART to the computer serial monitor. After the data is collected after each run, the data is processed and then fed into two arrays in MATLAB. From the obtained data we can form two arrays, one is for the LM335 readings and the other is for the thermistor resistance values. We can further estimate the curve parameter values by fitting the measured data to a known model.
A typical NTC thermistor has the following characteristics:
\[R=r_{\infty}e^{\frac{B}{T}}\]
Since MATLAB does not have an out-of-box function for this type of curve fitting, I used an alternative two-term exponential function:
\[f(x)=a*e^{bx}+c*e^{dx}\]
Other forms of functions such as polynomials can also be used and should also give satisfactory results. But since we know the nature of the R-T relationship, the exponential curve fitting should give less error and be applicable over a large temperature range. The following code snippet shows the MATLAB function calls for the curve fitting portion.
f18 = fit(R18Temp’, R18Val’, ‘exp2′);
f10 = fit(R10Temp’, R10Val’, ‘exp2′);
f8 = fit(R8Temp’, R8Val’, ‘exp2’);
And the figures below show the R-T measurements of the three different NTC thermistors with the measured data and fitted curve overlaid.
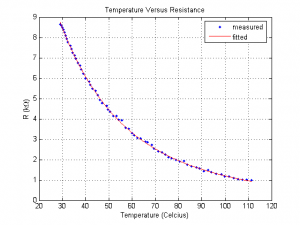
a = 17.94
b = -0.05082
c = 8.424
d = -0.02041
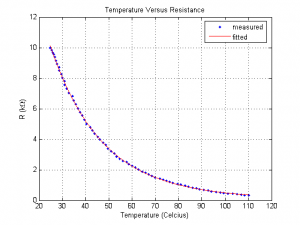
a = 28.68
b = -0.04817
c = 2.544
d = -0.02274
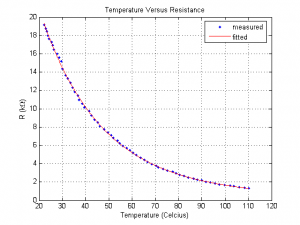
a = 40
b = -0.04112
c = 4.416
d = -0.01477

