In this blog post, Let’s take a look at how to measure a filter’s frequency response using a spectrum analyzer and a signal generator. Typically, a tracking generator is preferred for this kind of scalar network analysis as its center frequency is in-sync with the frequency the spectrum analyzer’s bandwidth filter is currently tuned to. But with a good signal generator, we can manually sweep across the desired frequency range and obtain similar amplitude versus frequency measurements.
Since the manual frequency sweep is not synchronized with the sweep of the spectrum analyzer, the frequency sweep speed needs to be significantly slower than the sweep speed of the spectrum analyzer. Otherwise the spectrum analyzer will not be able to capture the amplitude information at all frequency points. In most cases, a single sweep can take a few minutes to finish. Because this limitation, the manual sweep method is only suitable for analyzing devices in which the frequency response does not change significantly over time.
But there are also some benefits using the manual sweep technique. If you have a good signal generator, chances are that its output amplitude remains flat over a wide frequency range. This eliminates the need to calibrate the tracking generator’s output prior to measurements. It also improves the measurement accuracy as DUT‘s response to amplitude change may not be linear and thus even with corrected tracking generator output, the measured response curve can deviate from the true response given the non-linearity. Also, for some DUTs, devices characteristics can be adjusted for each frequency range without having to start a new sweep (i.e. manual sweep can be stopped and resumed at arbitrary frequency points) and thus we are able to obtain a complete frequency response curve with a single sweep.
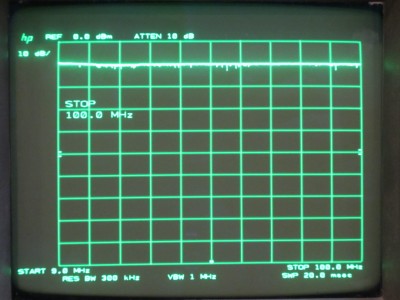
In the experiments below, I used a HP 8566B spectrum analyzer and a HP 8642B signal generator. The picture below shows the frequency response of the signal generator from 9 Mhz to 100 MHz with a feed-through cable. The signal was set to -10 dBm. As you can see the output is very flat for the entire frequency range. The is some noise on the trace and this is due to the fact that HP 8642B needs considerably amount of time to settle after a frequency is set and I did not dial the frequency up as gradually as I should have.
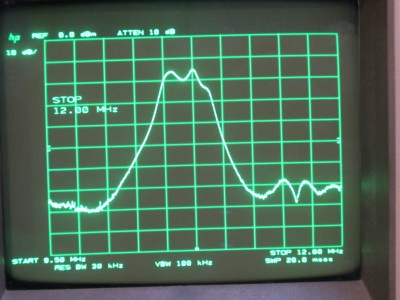
In my first experiment, I measured the bandpass characteristics of a 10.7 MHz IF ceramic filter. The result is exactly what should be expected. From this image, you can clearly see the insertion loss and the filter bandwidth.
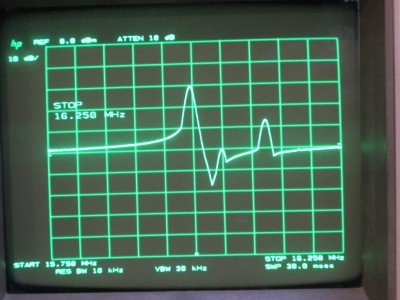
The next experiment investigates the frequency response of a 16 MHz crystal oscillator. Besides the classic crystal oscillator resonance curve, you can also see other frequency modes in this picture with magnitudes much lower than the main oscillation frequency.
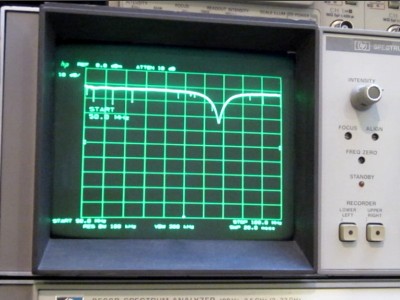
In my last experiment, the DUT was a parallel LC circuit. I used a 68 pF capacitor and the exact value of the hand-wound inductor was unknown. The resonant frequency is somewhere between 50 MHz and 100 MHz. Thus the frequency sweep was set to be between 50 MHz and 100 MHz on the spectrum analyzer. The resonant frequency can be spotted at the dip of the measured response curve below.
Here I made a short video showing these three experiments:


